
You've poured your heart into writing your book, but when it comes to marketing, you're mostly guessing. You post on social media, run a few ads, and hope something sticks. That's where book marketing analytics changes everything. At its core, book marketing analytics means using real data to understand what's working, what's wasting your budget, and where your readers actually come from. For independent authors and self-publishers, this shift from gut feeling to evidence is not just helpful. It's the difference between a book that sells and one that sits.
Table of Contents
- Key Takeaways
- What book marketing analytics actually means
- How to track book marketing performance
- Turning data into better marketing decisions
- Advanced targeting with first-party and third-party data
- My honest take on book marketing analytics
- How Booksculpt helps you put analytics into practice
- FAQ
Key Takeaways
| Point | Details |
|---|---|
| Analytics replaces guesswork | Tracking metrics like CPA and ROAS tells you exactly which campaigns drive sales. |
| UTM parameters are non-negotiable | Properly tagged links reveal which traffic sources actually convert to book buyers. |
| Amazon KDP dashboard is your baseline | Weekly review of sales and KENP reads connects marketing actions to real revenue. |
| Vanity metrics mislead authors | Likes and follower counts rarely predict sales; conversion rates and review patterns do. |
| First-party data sharpens targeting | Combining your email list with ad analytics builds reader personas that improve every campaign. |
What book marketing analytics actually means
Book marketing analytics replaces guesswork with evidence-based decision making by tracking key metrics like cost per acquisition (CPA), return on ad spend (ROAS), and conversion rates. Simply put, it is the practice of collecting, measuring, and interpreting data from every channel you use to promote your book, then using those findings to make smarter decisions.
The scope is broader than most authors expect. Book marketing analytics covers:
- Sales data from platforms like Amazon KDP, including daily units sold and Kindle Unlimited page reads
- Ad performance data from Facebook, Amazon Ads, or BookBub, showing what you spend versus what you earn
- Website and landing page data from tools like Google Analytics 4, revealing how visitors behave before they buy
- Email marketing metrics like open rates, click rates, and conversion rates from your newsletter campaigns
- Social media engagement tied directly to spikes or dips in sales, not just follower counts
The key distinction that trips up most authors is the difference between signals and noise. A spike in Instagram likes after a post feels exciting, but if it produces zero sales, it is noise. A 12% click-through rate on an email that drives 40 book purchases in 48 hours? That is a signal worth studying and repeating.
"Data-driven book marketing is not just for large publishers. Indie authors benefit greatly by using first- and third-party data to focus their marketing budgets efficiently." (Effective Book Marketing Campaigns with Data Analytics)
Understanding book analytics at this foundational level gives you a framework for every marketing decision you make going forward.
How to track book marketing performance
Knowing what to measure is only half the battle. You also need a practical system for collecting that data without spending hours buried in spreadsheets. Here is a step-by-step approach that works for indie authors at any experience level.
-
Set up UTM parameters for every link you share. UTM parameters are small tags you add to URLs that tell Google Analytics exactly where your traffic came from. The three you need every time are "utm_source
(e.g., "facebook"),utm_medium(e.g., "paid-ad"), andutm_campaign` (e.g., "launch-week"). Without these, traffic often gets lumped into "direct," making it impossible to know which channel drove a sale. -
Connect Google Analytics 4 to your author website or book landing page. GA4 tracks how visitors move through your pages, which buttons they click, and where they drop off before buying. This is where you see whether your book description is converting or sending people away.
-
Review your Amazon KDP dashboard every week. The KDP Orders and KENP Reads reports show you exactly how sales move in response to your marketing activities. Run a price promotion on Tuesday? Check the dashboard Thursday to see the lift.
-
Install platform pixels on your website. A Facebook Pixel or Amazon Attribution tag tracks what users do after clicking your ads, even across devices.
-
Log your marketing activities in a simple calendar. When you correlate your activity log with your KDP data, patterns emerge fast.
Pro Tip: Consistent UTM naming conventions are critical. If one team member writes "Facebook" and another writes "facebook," Google Analytics treats them as two separate sources. Decide on your naming rules before you launch any campaign and write them down.
One common pitfall to avoid: combining platform pixels with website analytics gives you a much fuller picture of the customer journey than relying on either source alone. Platform pixels alone miss cross-device behavior because of privacy restrictions. Together, they fill in the gaps.
Turning data into better marketing decisions
Collecting data is the easy part. Making sense of it and using it to improve your book marketing strategy is where most authors get stuck. The good news is that you do not need to be a data scientist. You need a clear framework for separating what matters from what does not.

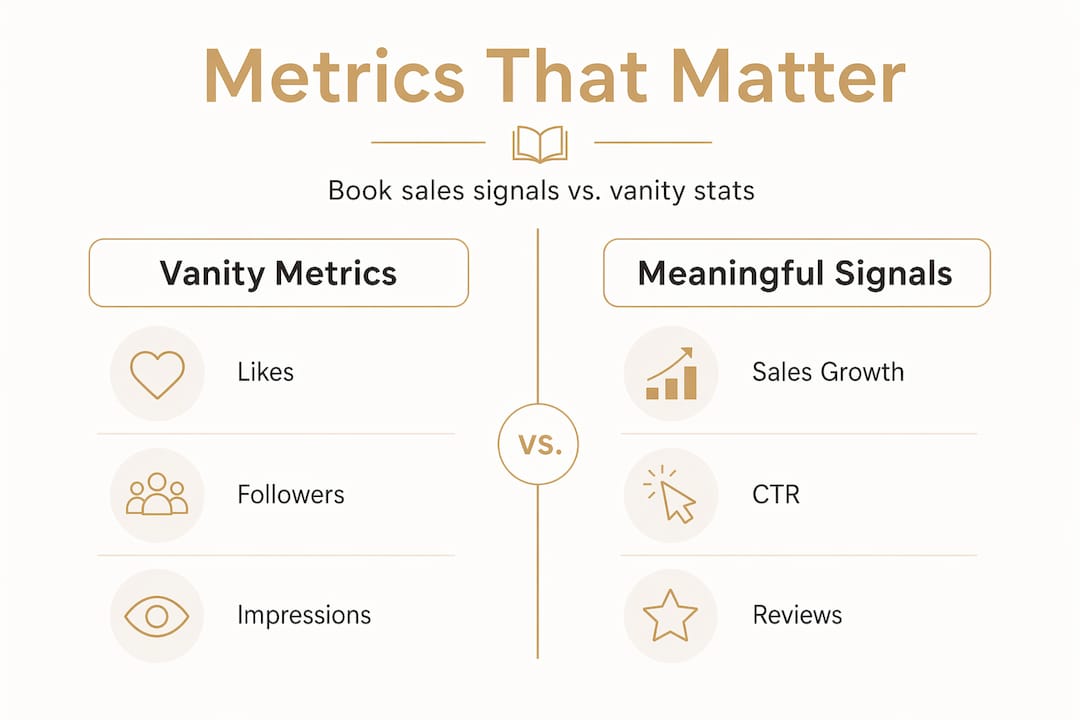
Vanity metrics vs. meaningful signals
Only patterns tied directly to buyer behavior predict sustainable sales growth. Social media likes and follower counts feel good, but they rarely move the needle on sales. Here is a quick comparison to keep you grounded:
| Vanity Metric | Meaningful Signal |
|---|---|
| Instagram likes on a cover reveal | Click-through rate from that post to your buy page |
| Total email subscribers | Email-to-purchase conversion rate |
| Amazon Best Seller badge (one day) | Sustained week-over-week sales trend |
| Ad impressions | Cost per acquisition (CPA) per sale |
| Review star average | Specific praise patterns in review text |
Notice that last row. Strong reviews with specific praise, where readers mention the pacing, the world-building, or a particular character, tell you exactly what to highlight in your ad copy and book description. That is analyzing your book audience at a level most authors never reach.
Using data to refine your campaigns
Once you spot a meaningful signal, act on it. If your email campaigns consistently outperform your Facebook ads in CPA, shift budget toward email. If your Amazon Ads perform well for one keyword cluster but waste money on another, pause the underperformers and double down on what converts.
A/B testing is your best friend here. Change one variable at a time: your book cover image in an ad, your subject line, or your call to action. Run each version for at least seven days before drawing conclusions. Small improvements in conversion rate on your book page can notably boost ROI across every ad you run, because the same traffic converts at a higher rate.
Pro Tip: Use your KDP dashboard as an early warning system. Proactive weekly analysis lets you spot momentum loss early, so you can trigger a promotion or price change before sales plateau rather than after.
Long-term trend analysis matters just as much as short-term wins. Look at 90-day windows, not just last week. Seasonal patterns, category trends, and the cumulative effect of consistent marketing all show up when you zoom out.
Advanced targeting with first-party and third-party data
Once you have the basics running, you can take your book performance tracking to the next level by combining different data sources into a more complete picture of your reader.
First-party data is information you collect directly from your audience. Your email list, purchase history from your own website, and survey responses all qualify. This data is the most accurate and the most valuable because you own it.
Third-party data comes from external platforms: Facebook audience insights, Amazon Ads reports, and Google Analytics. These platforms observe behavior across millions of users and let you layer that context onto your own audience.
Here is how you can combine them effectively:
- Upload your email list to Facebook as a Custom Audience to find readers who look just like your existing buyers
- Cross-reference your highest-converting email segments with your Amazon Ads keyword data to find overlapping interest patterns
- Use GA4's audience reports to see which content topics on your blog or website attract visitors who then go on to buy
Combining first-party data with third-party analytics helps you build reader personas that are grounded in real behavior, not assumptions. A persona built from actual purchase data and email engagement is far more useful than one built from demographic guesses.
| Data Type | Source Examples | Best Use |
|---|---|---|
| First-party | Email list, purchase records | Lookalike audiences, direct retargeting |
| Third-party | Facebook Insights, Amazon Ads | Interest targeting, keyword expansion |
| Combined | GA4 + KDP + email platform | Full-funnel reader persona building |
Predictive analytics is the next step for authors who want to go deeper. By analyzing patterns in past campaigns, you can forecast which upcoming promotions are likely to perform well and allocate budget accordingly. You do not need advanced software to start. A spreadsheet tracking CPA and ROAS across your last ten campaigns already gives you a baseline for prediction.
My honest take on book marketing analytics
I have watched a lot of indie authors burn out chasing metrics that feel important but do not actually move their sales. The biggest mistake I see is treating analytics as a scoreboard instead of a decision-making tool.
In my experience, the authors who get the most out of book marketing analytics are not the ones with the most data. They are the ones with the most consistent habits. Reviewing your KDP dashboard every Monday morning, tagging every link before you share it, and running one A/B test per month will teach you more about your readers in six months than years of posting and hoping.
What I have learned is that you should start with one or two metrics that connect directly to revenue, CPA and conversion rate are my top picks, and ignore everything else until those are stable. Once you have a reliable read on those numbers, add one more layer. Consistent, repeatable marketing activities combined with optimized book pages create sustainable momentum that analytics can track and amplify over time.
The authors I respect most treat their marketing data the way a good editor treats a manuscript. They read it carefully, look for what is not working, and make targeted changes. They do not rewrite the whole book because one chapter is weak. They fix the chapter. That patience and precision is what separates authors who grow steadily from those who spike once and disappear.
Start small. Build the habit. The sophistication will follow naturally.
— Soumitra Belani
How Booksculpt helps you put analytics into practice
If reading this article made you realize how much data you have been leaving on the table, you are not alone. Most indie authors have the instincts but not the infrastructure to act on their marketing data.
Booksculpt is built specifically for self-publishers who want every part of their publishing workflow in one place, including the marketing side. The platform's integrated marketing features connect your publishing activity with performance tracking so you are not piecing together five different tools to get a clear picture. From KDP formatting to multi-platform distribution, Booksculpt covers the full workflow. Check out the how it works guide to see how authors are using it to make smarter, data-guided decisions from day one. Plans start at $19/month, and you can explore all pricing options to find the right fit for where you are in your publishing journey.
FAQ
What is book marketing analytics in simple terms?
Book marketing analytics is the practice of tracking and interpreting data from your book promotions to understand what drives sales. It replaces guesswork with measurable evidence so you can spend your marketing budget more effectively.
Which book marketing metrics matter most for indie authors?
Cost per acquisition (CPA), return on ad spend (ROAS), and email-to-purchase conversion rate are the most directly tied to revenue. Vanity metrics like likes and impressions rarely predict actual sales growth.
How do I start tracking my book marketing performance?
Start by adding UTM parameters to every link you share and connecting Google Analytics 4 to your author website. Then review your Amazon KDP dashboard weekly to correlate your marketing activities with sales trends.
What are book analytics tools I can use for free?
Google Analytics 4 and the Amazon KDP dashboard are both free and give you enough data to make meaningful decisions. For paid ads, Facebook Ads Manager and Amazon Advertising Console include built-in analytics at no extra cost beyond your ad spend.
How often should I analyze my book marketing data?
A weekly review of your KDP sales and a monthly review of campaign-level metrics like CPA and ROAS is a practical rhythm for most indie authors. More frequent checks can lead to reactive decisions based on short-term noise rather than real trends.